Interactive Quick Look
Interactive quick look figures are available to view the coadded and abutted spectra. These are available on the target pages in the "Quick Look Plot" column of the tables:
Note that for the T Tauri stars, there may be additional time series products
for specific gratings, even if a quick look figure is available. If a
T Tauri star exhibited any variable behavior, then the exposures were not
coadded for that specific grating, and instead the 1-D spectra are available
in the level 5 time series products.
In the example screen captures below, this figure
for the SMC target AV 304 is used.
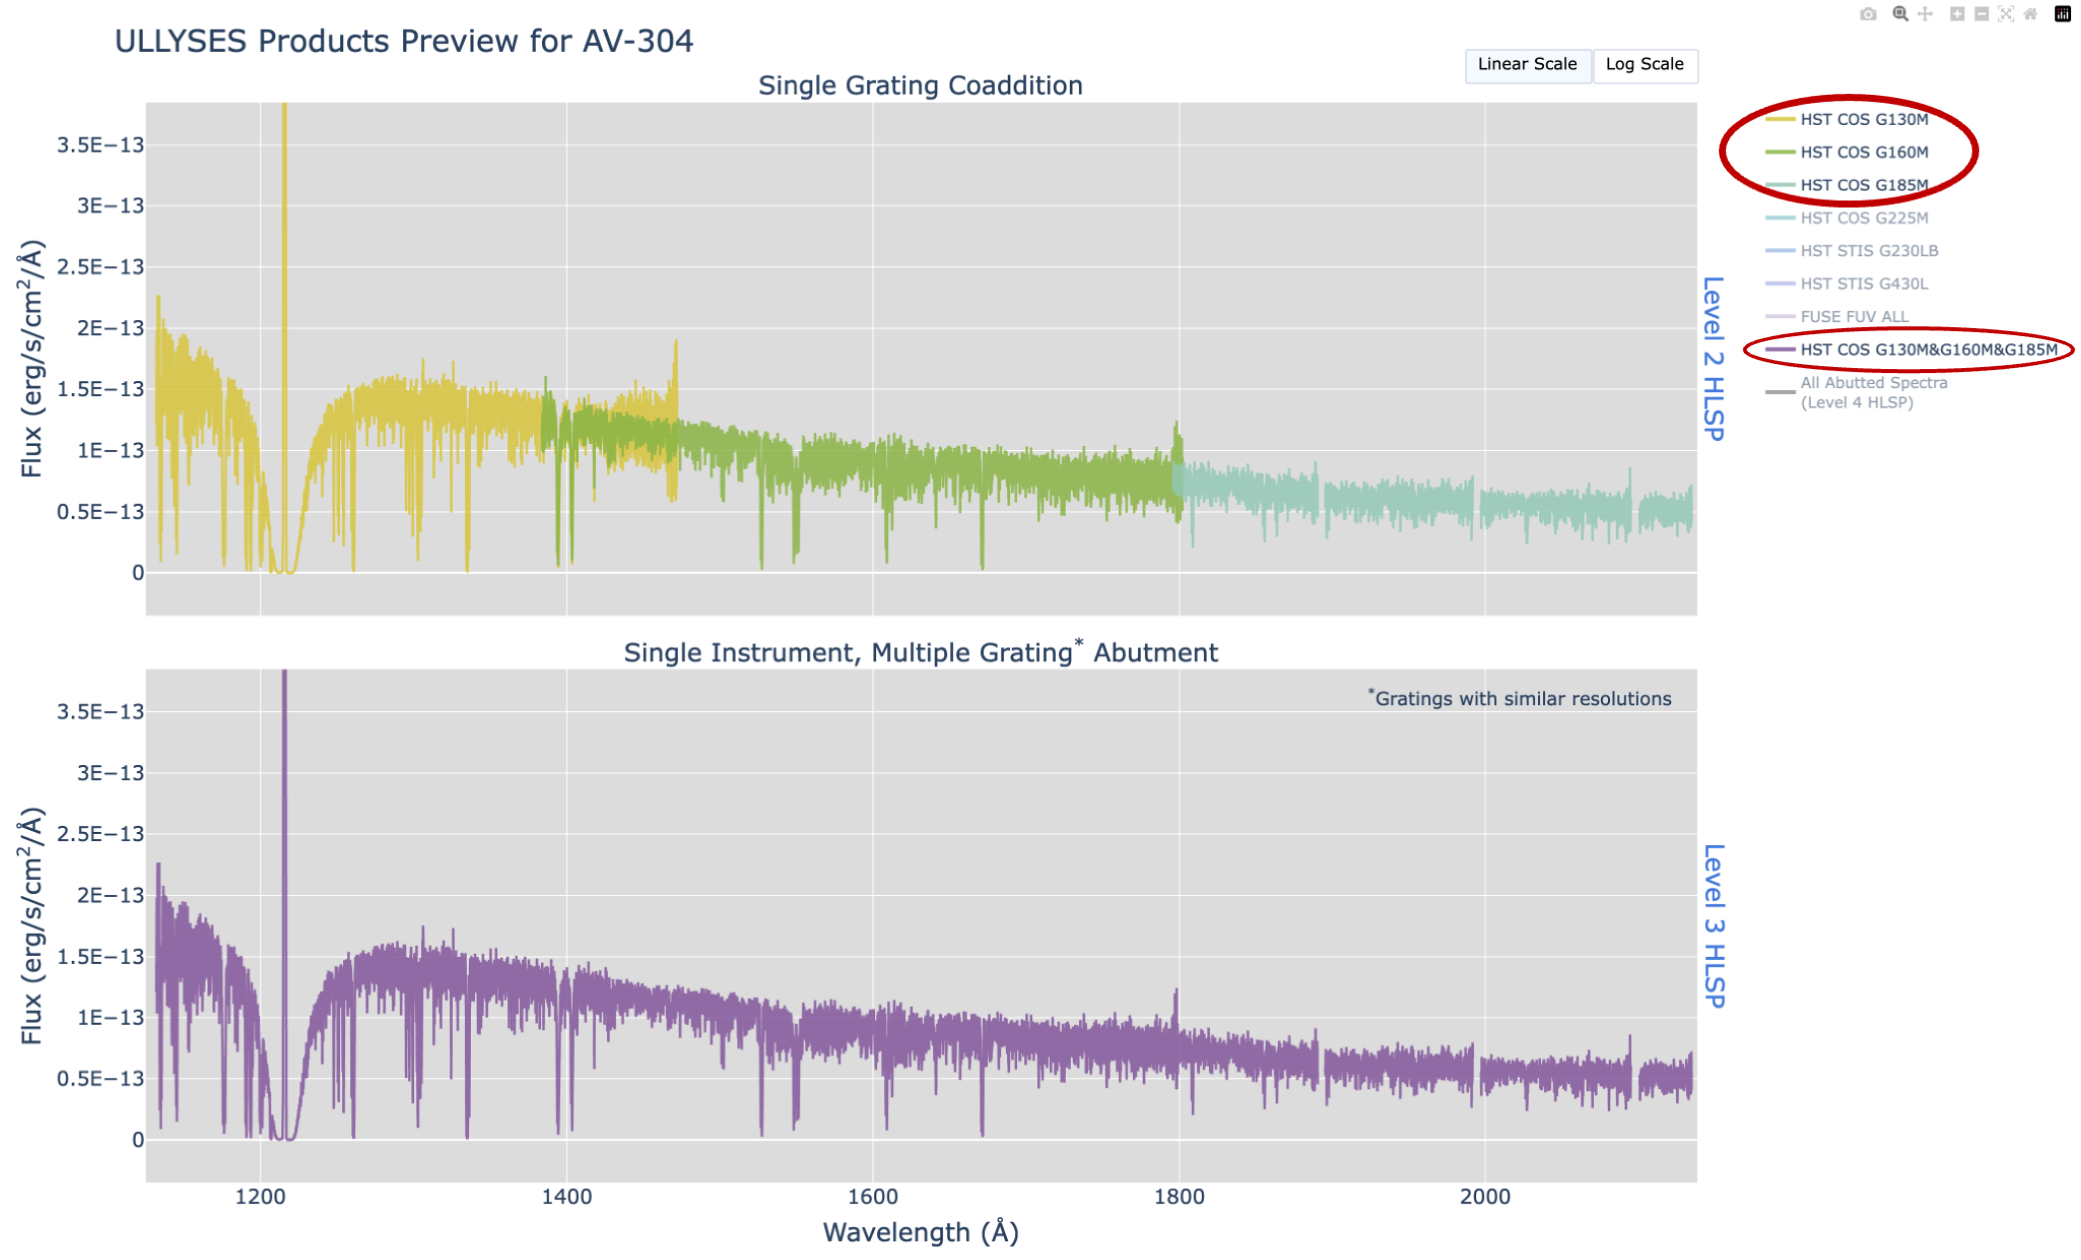
What is contained in the figure
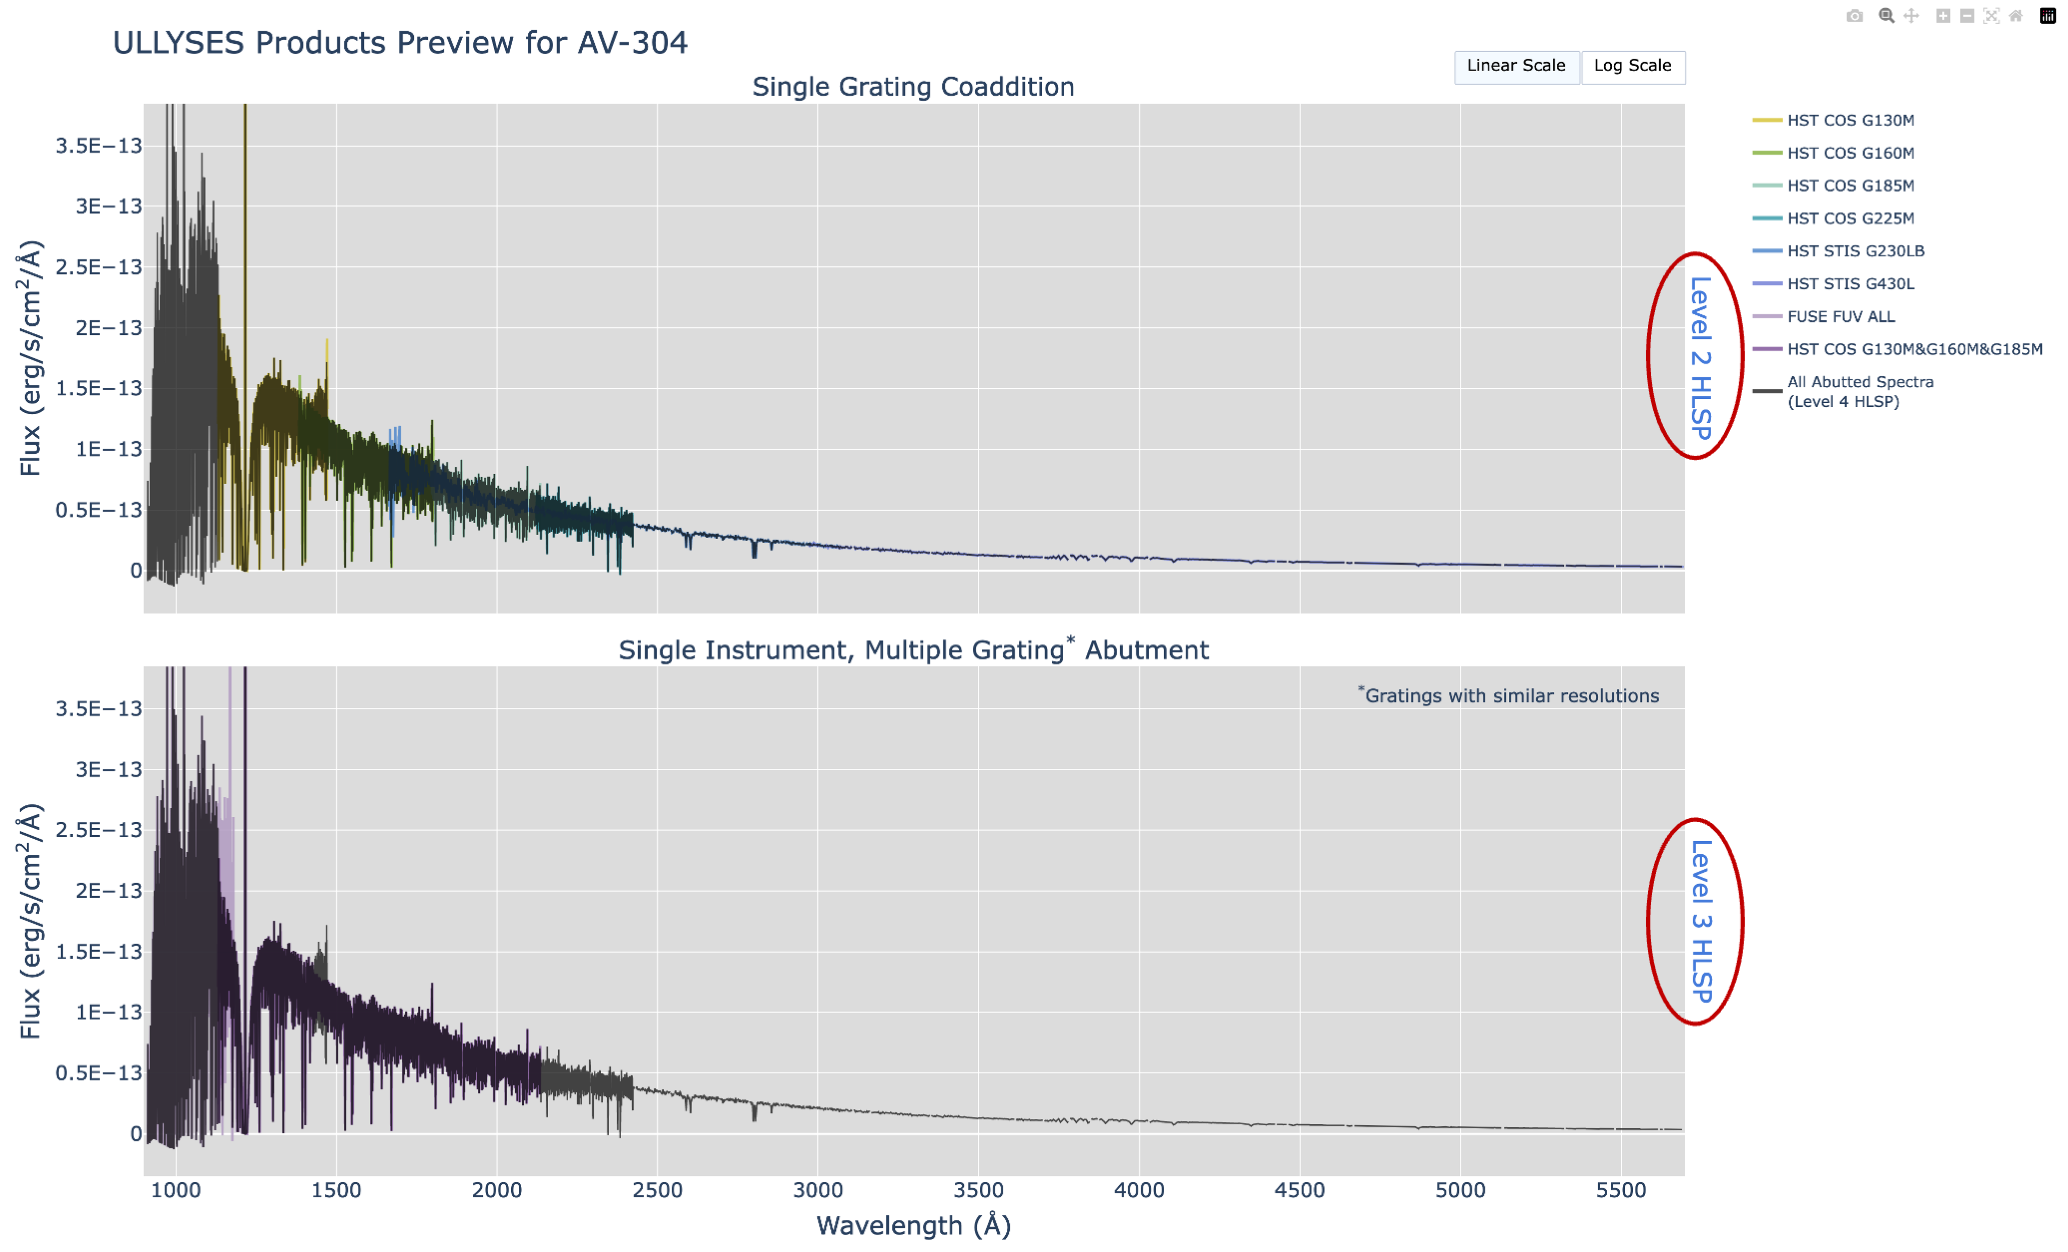
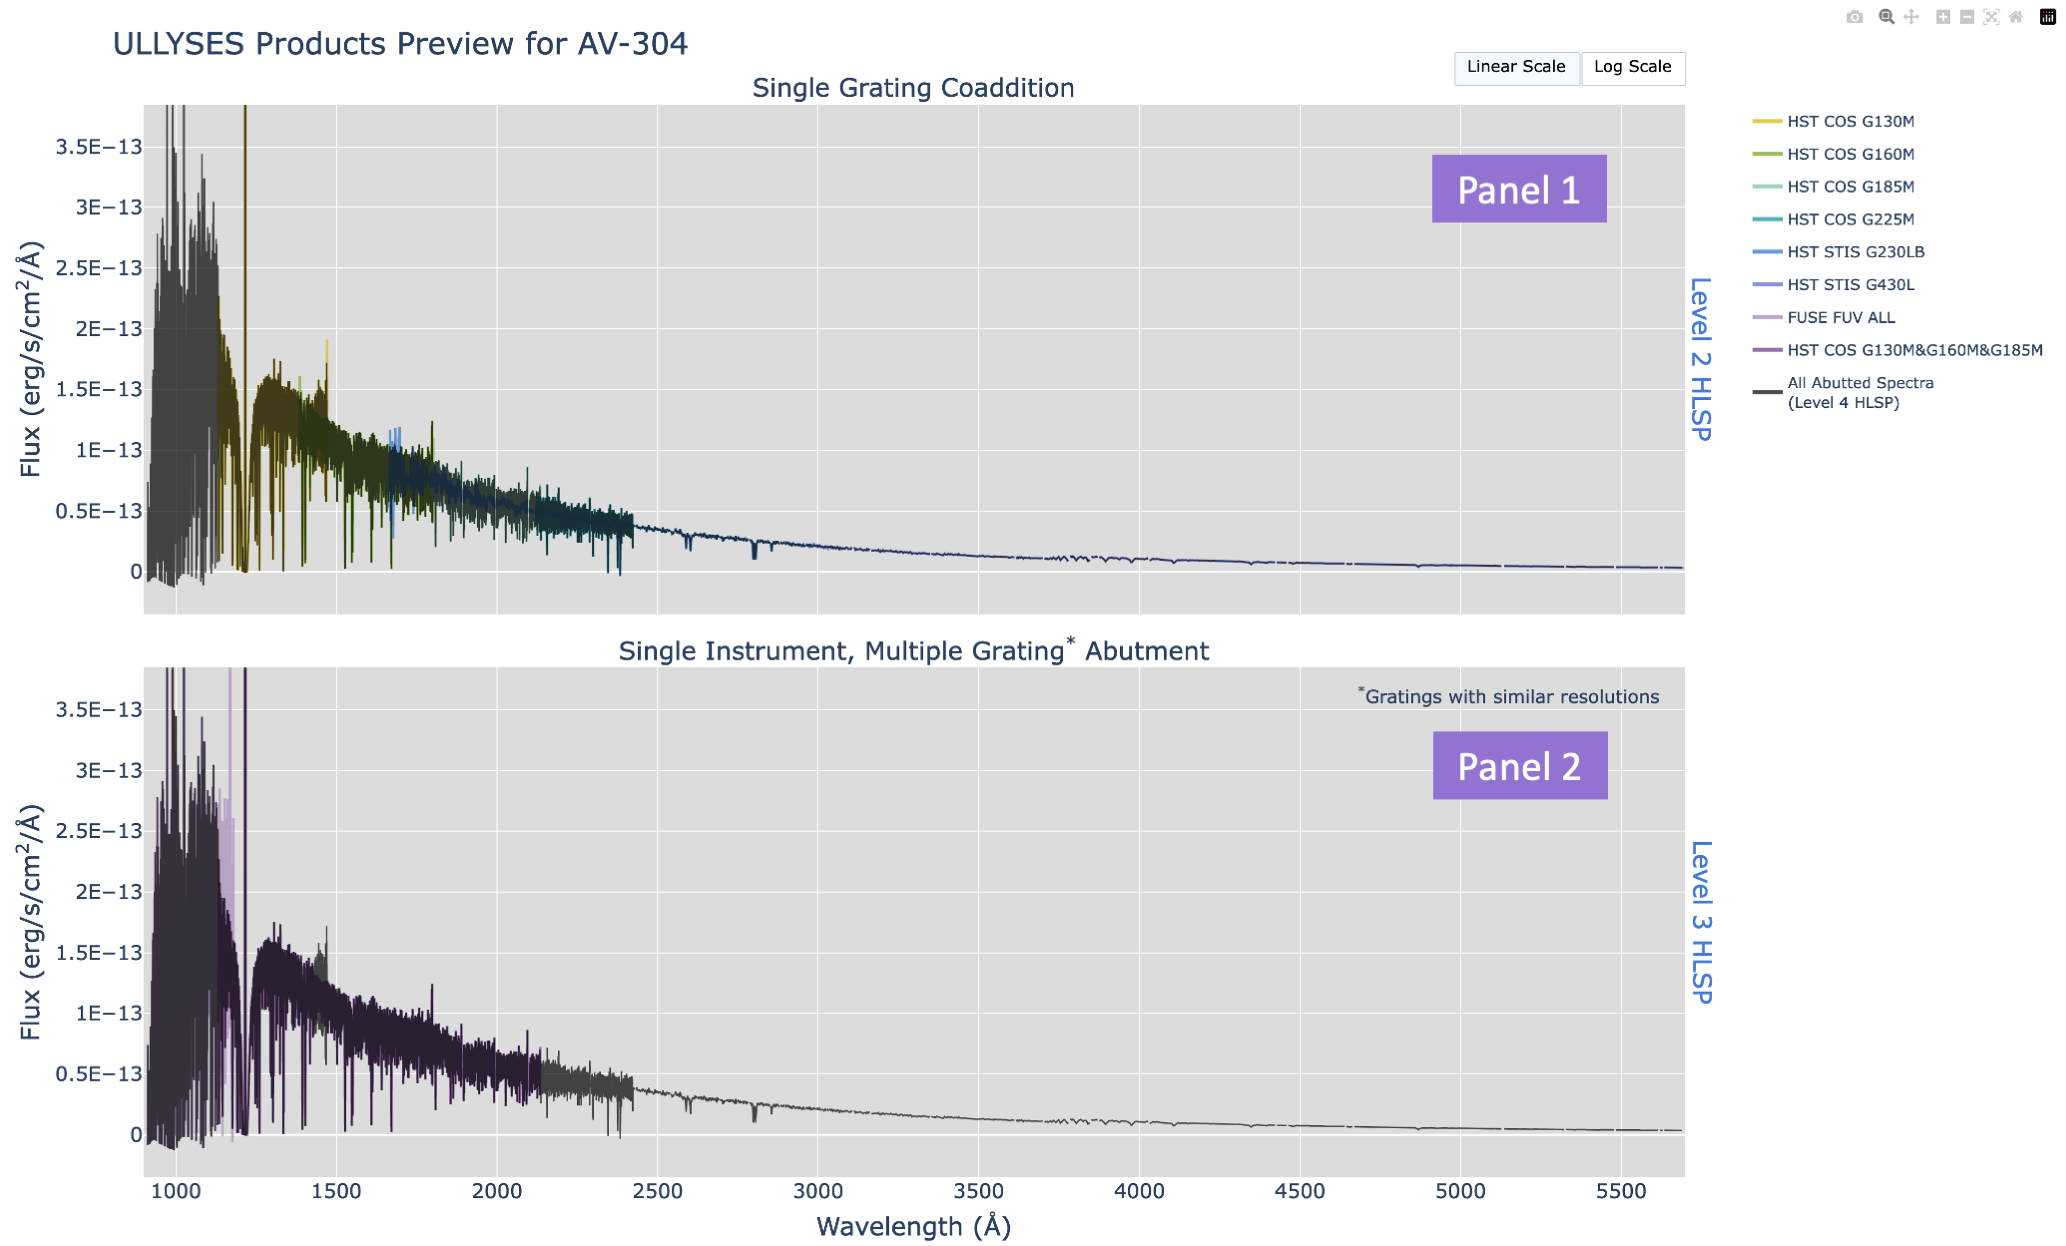
The interactive figure contains two panels showing the wavelength and fluxes
for the ULLYSES high level science products (HLSPs):
- Panel 1 shows the coadded (level 2, cspec) HLSPs
- Panel 2 shows the abutted (level 3, aspec) HLSPs
Additionally, shown in both panels is the abutted level 4 preview-spec HLSP.
How to interact with the figure
The interactive figure is created with the python package
plotly, and has
several advantages compared to a static figure. Outlined here are examples
to assist in navigating the interactive plots. There may be more features
available that are not highlighted here.
- Selection toolbar
- Using the legend to isolate an HLSP
- Log scale
- Hover information
- Link to documentation
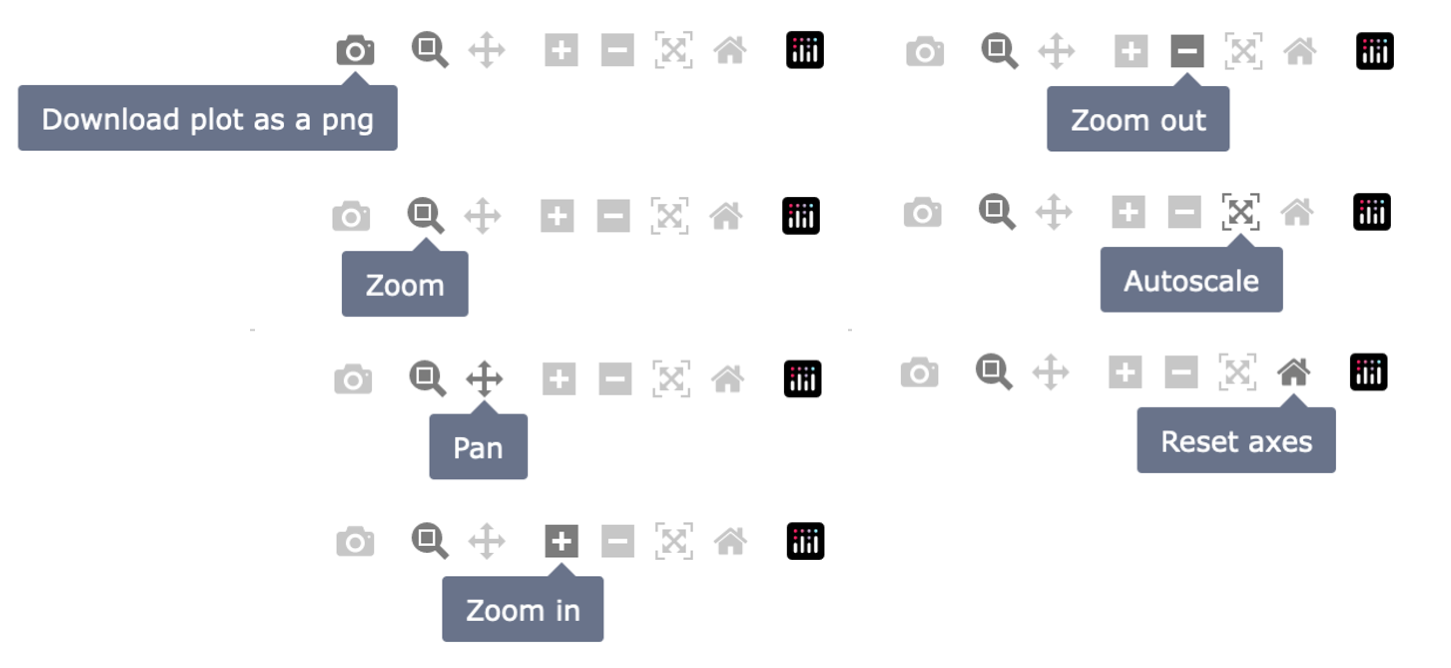
Selection toolbar
The toolbar in the top right corner of the figure has the controls for zooming, panning, resetting the axes, and downloading a static plot. Hover over each icon to determine what each tool will do. When selected:- "Download plot as a png" will download the current view of the plot.
- "Zoom" allows you to select a region to look at more closely.
- "Pan" allows you to move across the spectrum at a specific zoom.
- "Zoom in"/"Zoom out" will zoom in and out by the same amount for both axes.
- "Autoscale" will change the zoom range to be the minimum/maximum points contained on the plot.
- "Reset axes" will change the zoom range to be the pre-defined zoom ranges when the plot is originally opened.
Using the legend to isolate an HLSP
The legend on the right side of the figure allows for specific HLSPs to
be shown. By default, all HLSPs are shown as different colors. To not show
a specific HLSP, select the label on the legend. To show only one HLSP,
double click on the label on the legend. To show all HLSPs again, double
click on the same label. If an HLSP is not shown on the figure, then the
text in the legend will appear fainter. Two examples are shown below where
select HLSPs have been turned off.
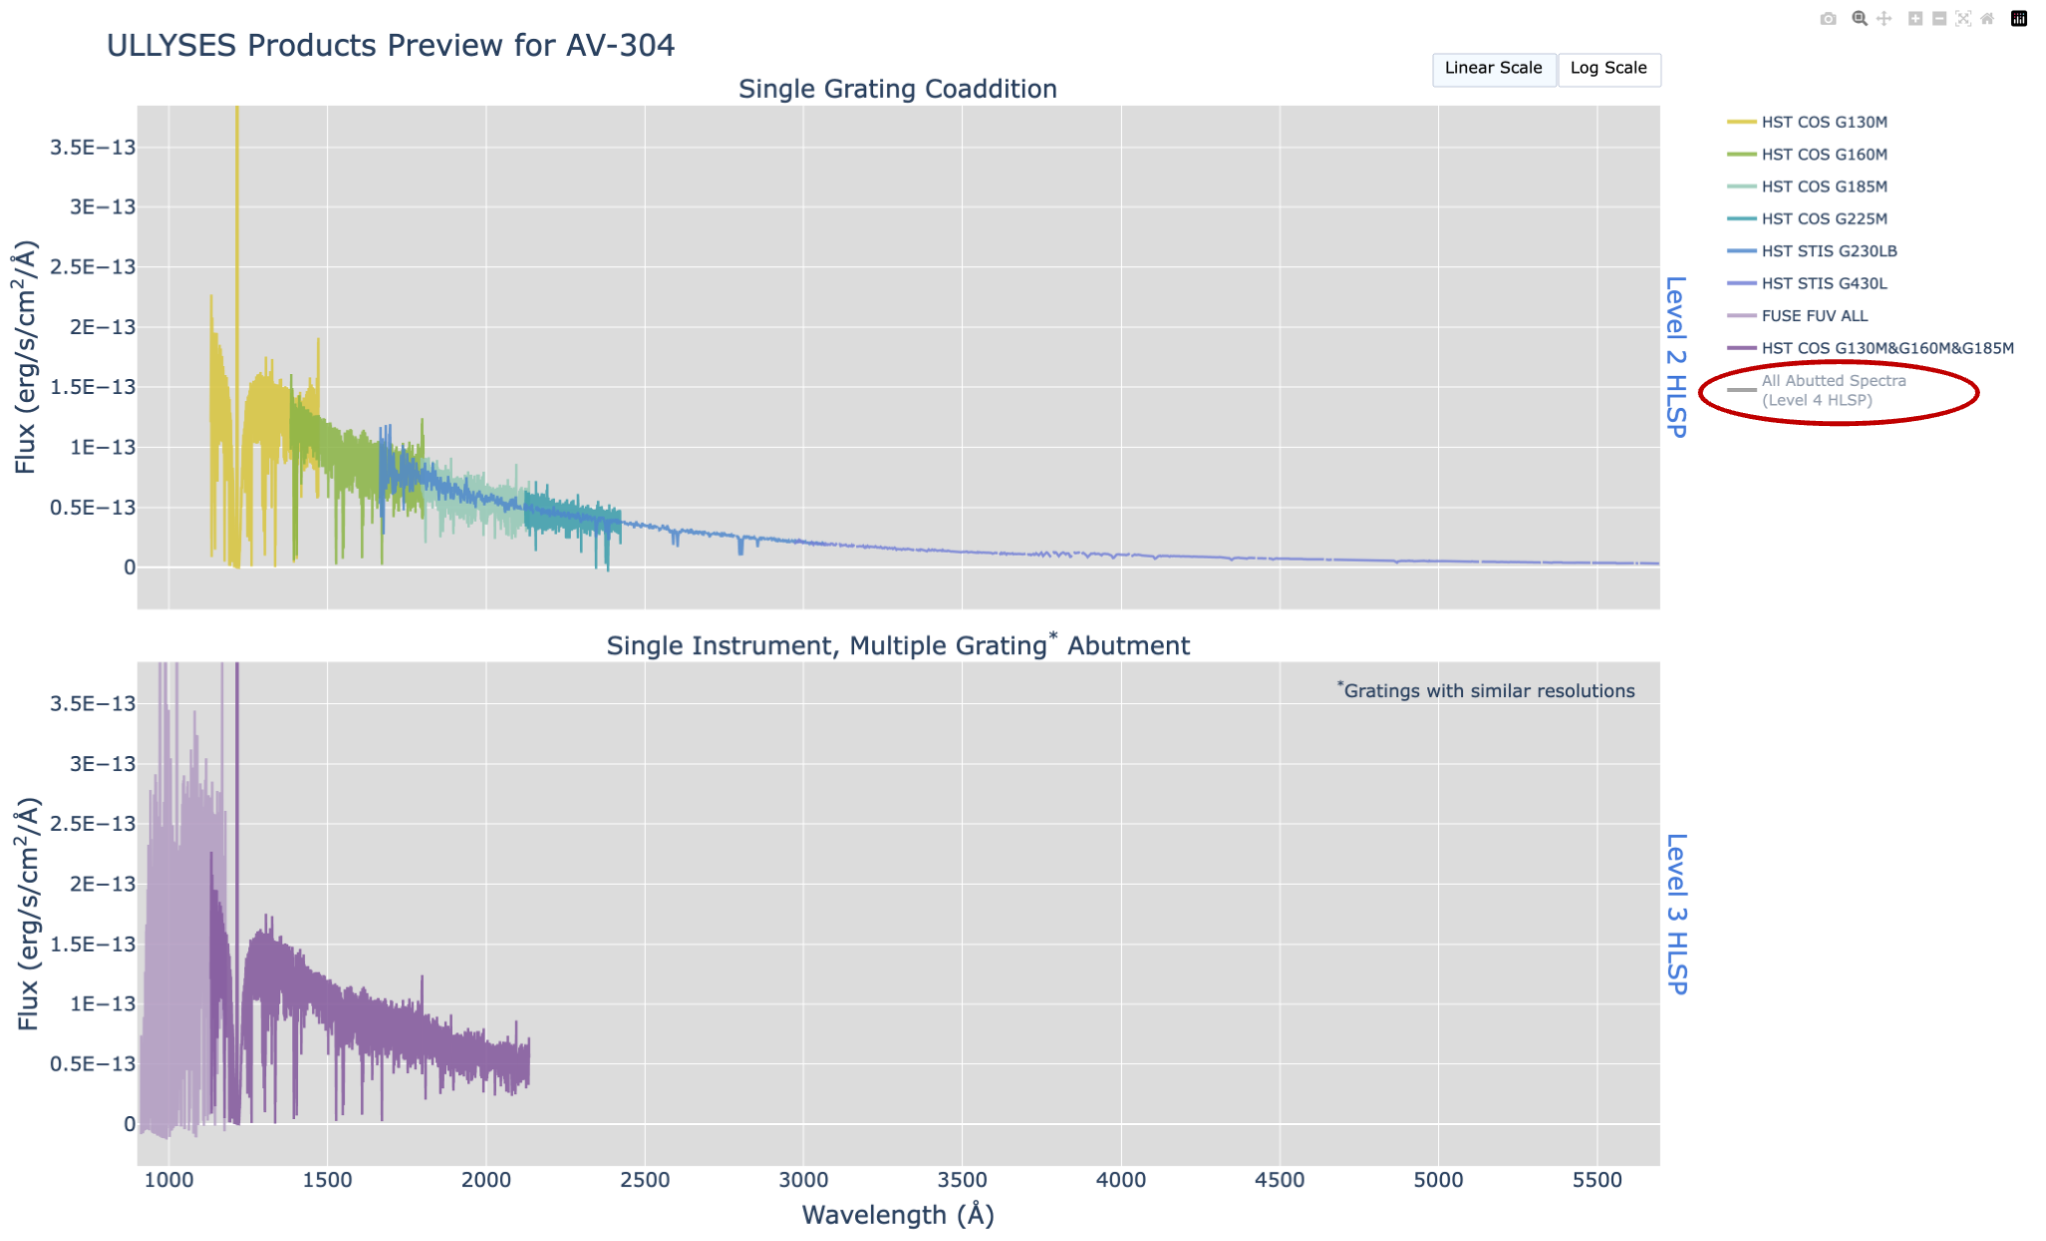
Example 1: The level 4 HLSP preview-spec.fits was selected on
the legend, which turned that spectrum off on the two panels. The label
for the level 4 HLSP is lighter than the other labels which indicates it
is not shown.
Example 2: Here we are only looking at the cspec products that
went into the medium resolution aspec product. The figure
will automatically adjust the x scale to show the maximum range of what
HLSPs have been selected. Note that more labels appear to be lighter in
this case because they are not being shown on the figure.
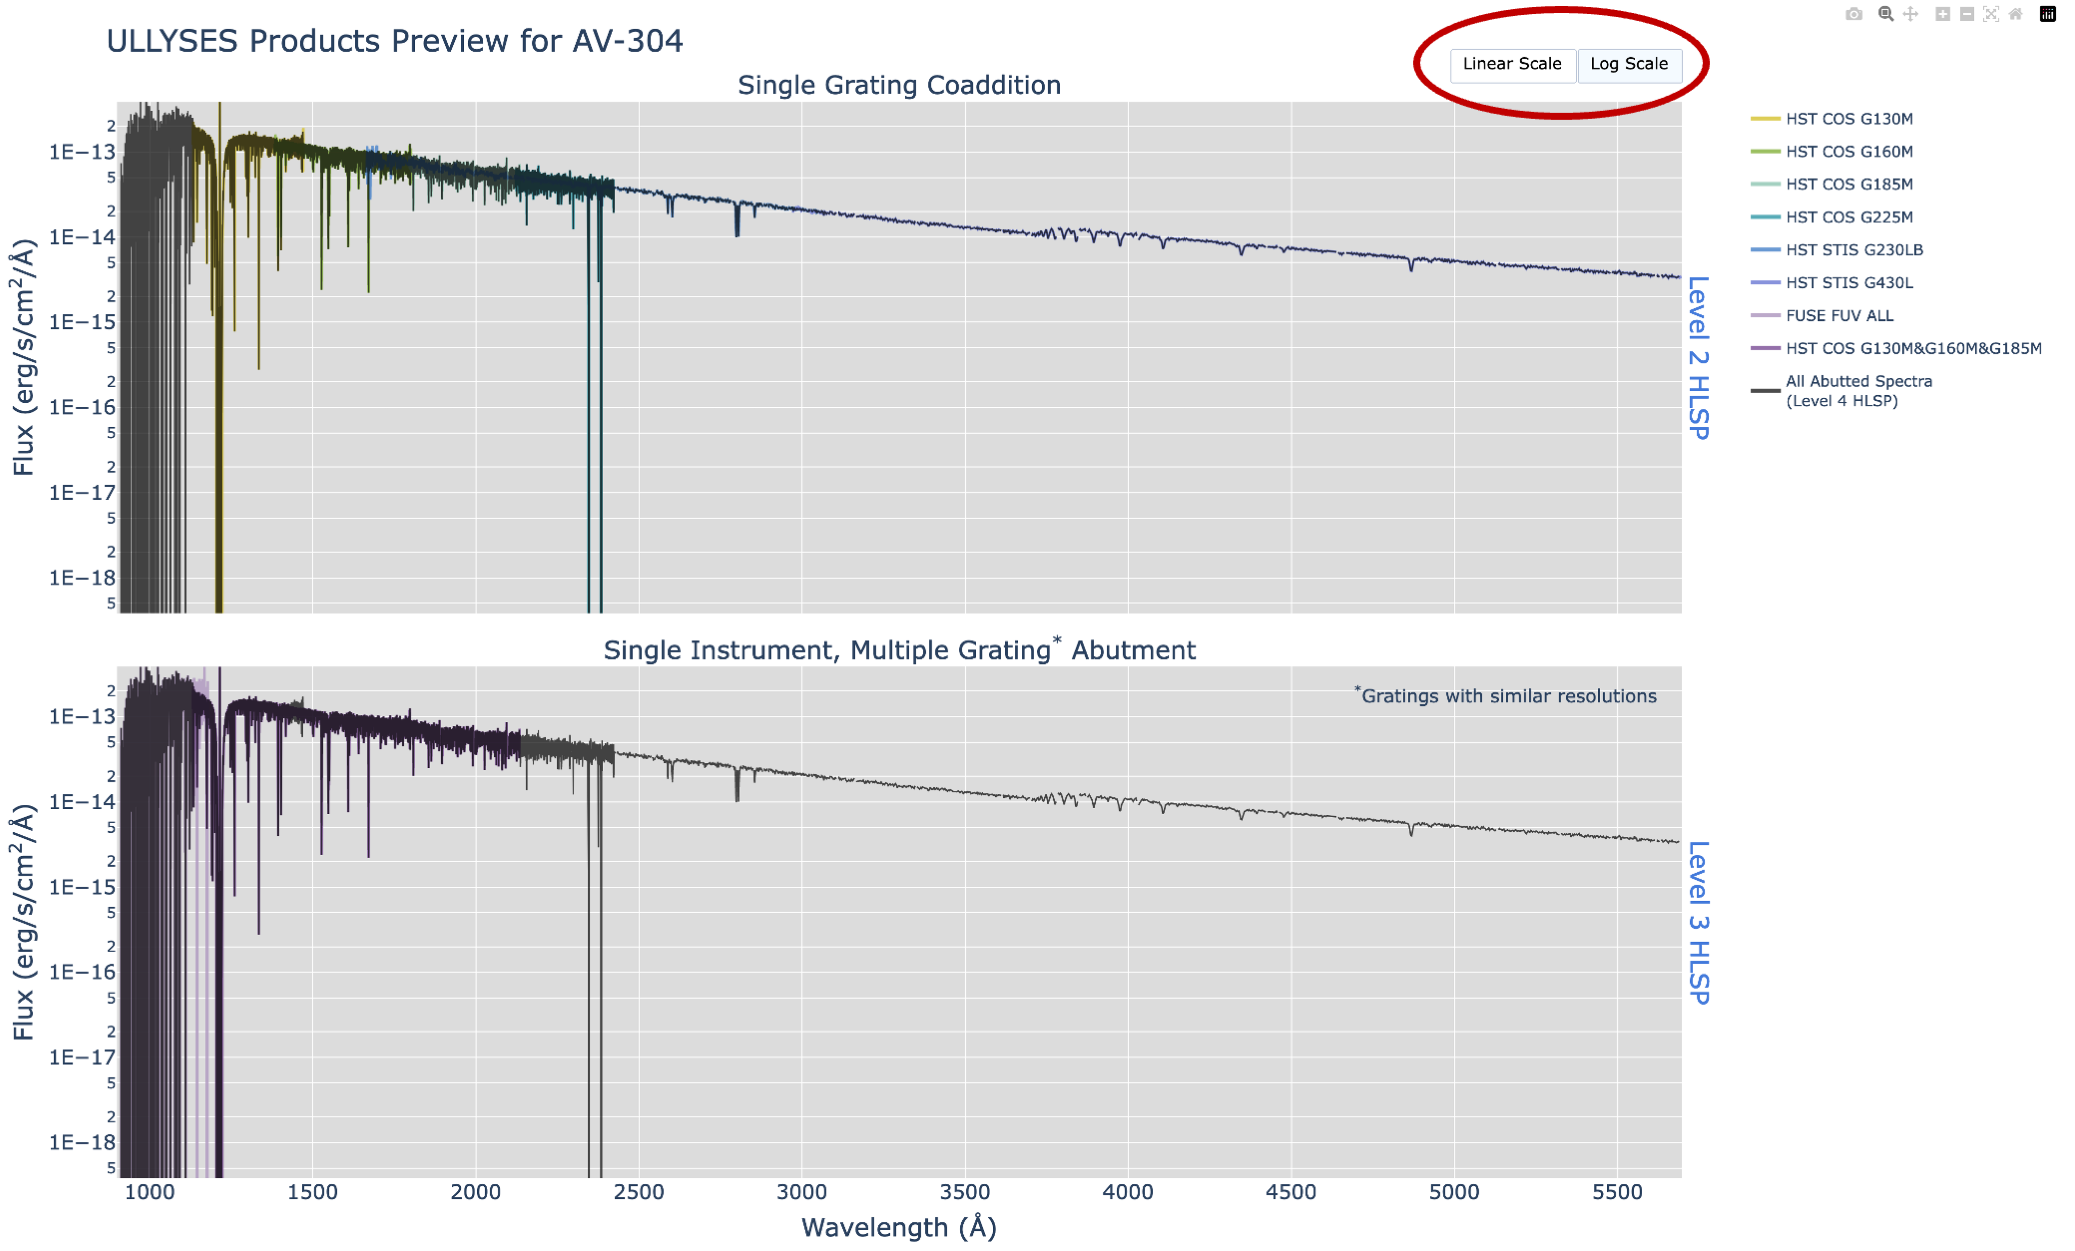
Log scale
There is a button on the right side above panel 1 that switches the scale
of the plot to be log instead of linear. Simply click on the button to
switch between linear and log scaling. Note that there are negative fluxes
that exist in the data from imperfect background subtraction, leading to
non-ideal default zoom ranges. Please use the zoom tool to better view
the spectra when using the log scale view.
Hover information
When mousing over a spectrum, a box will pop up that shows information
about what spectra are being shown at a specific wavelength. This repeats
information that is in the legend about what color the HLSP is shown in,
as well as the observatory, instrument, and grating at that location, and
their different flux values. This should assist in determining all available
HLSPs at any given wavelength.

Link to documentation
Included in the plot are hyperlinks that point to documentation about the
high level science products being shown. Click either of the links,
and they will then navigate to the
product description
page in a separate tab.